Monitors in the main menu watches your sites and scheduled jobs. The page has tabs: Your monitors, Add a monitor, Add a heartbeat, Incidents, Maintenance, and for some roles Alert emails, Status pages, Coolify and Webhooks. The tab you are on is part of the page address, so Back and Forward work.
Watch the video: Uptime monitors and heartbeats
Add a monitor
Open Monitors and choose Add a monitor. Give it a name and the address to check, then choose how often. Your plan sets the fastest: every 5 minutes on Free, every 1 minute on Solo and Team.
A monitor can be an HTTP or HTTPS check (the status code you expect, redirects, and a response time above which it counts as slow), or a keyword or API check (a word that must appear, a header, or a value in a JSON answer). There is no separate certificate monitor: every HTTPS monitor also checks the site's certificate. A certificate the browser would not trust counts as a failed check, and when the certificate has 30 days or less left the monitor shows Certificate ending (see When alerts are sent for the warning emails).
Before a monitor is created you tick a box: "I own this website or service, or I am authorised to test it, and I will not use this monitor in a way that overloads it." You can only point a monitor at an address you enter yourself. See the Terms of Service (G8).
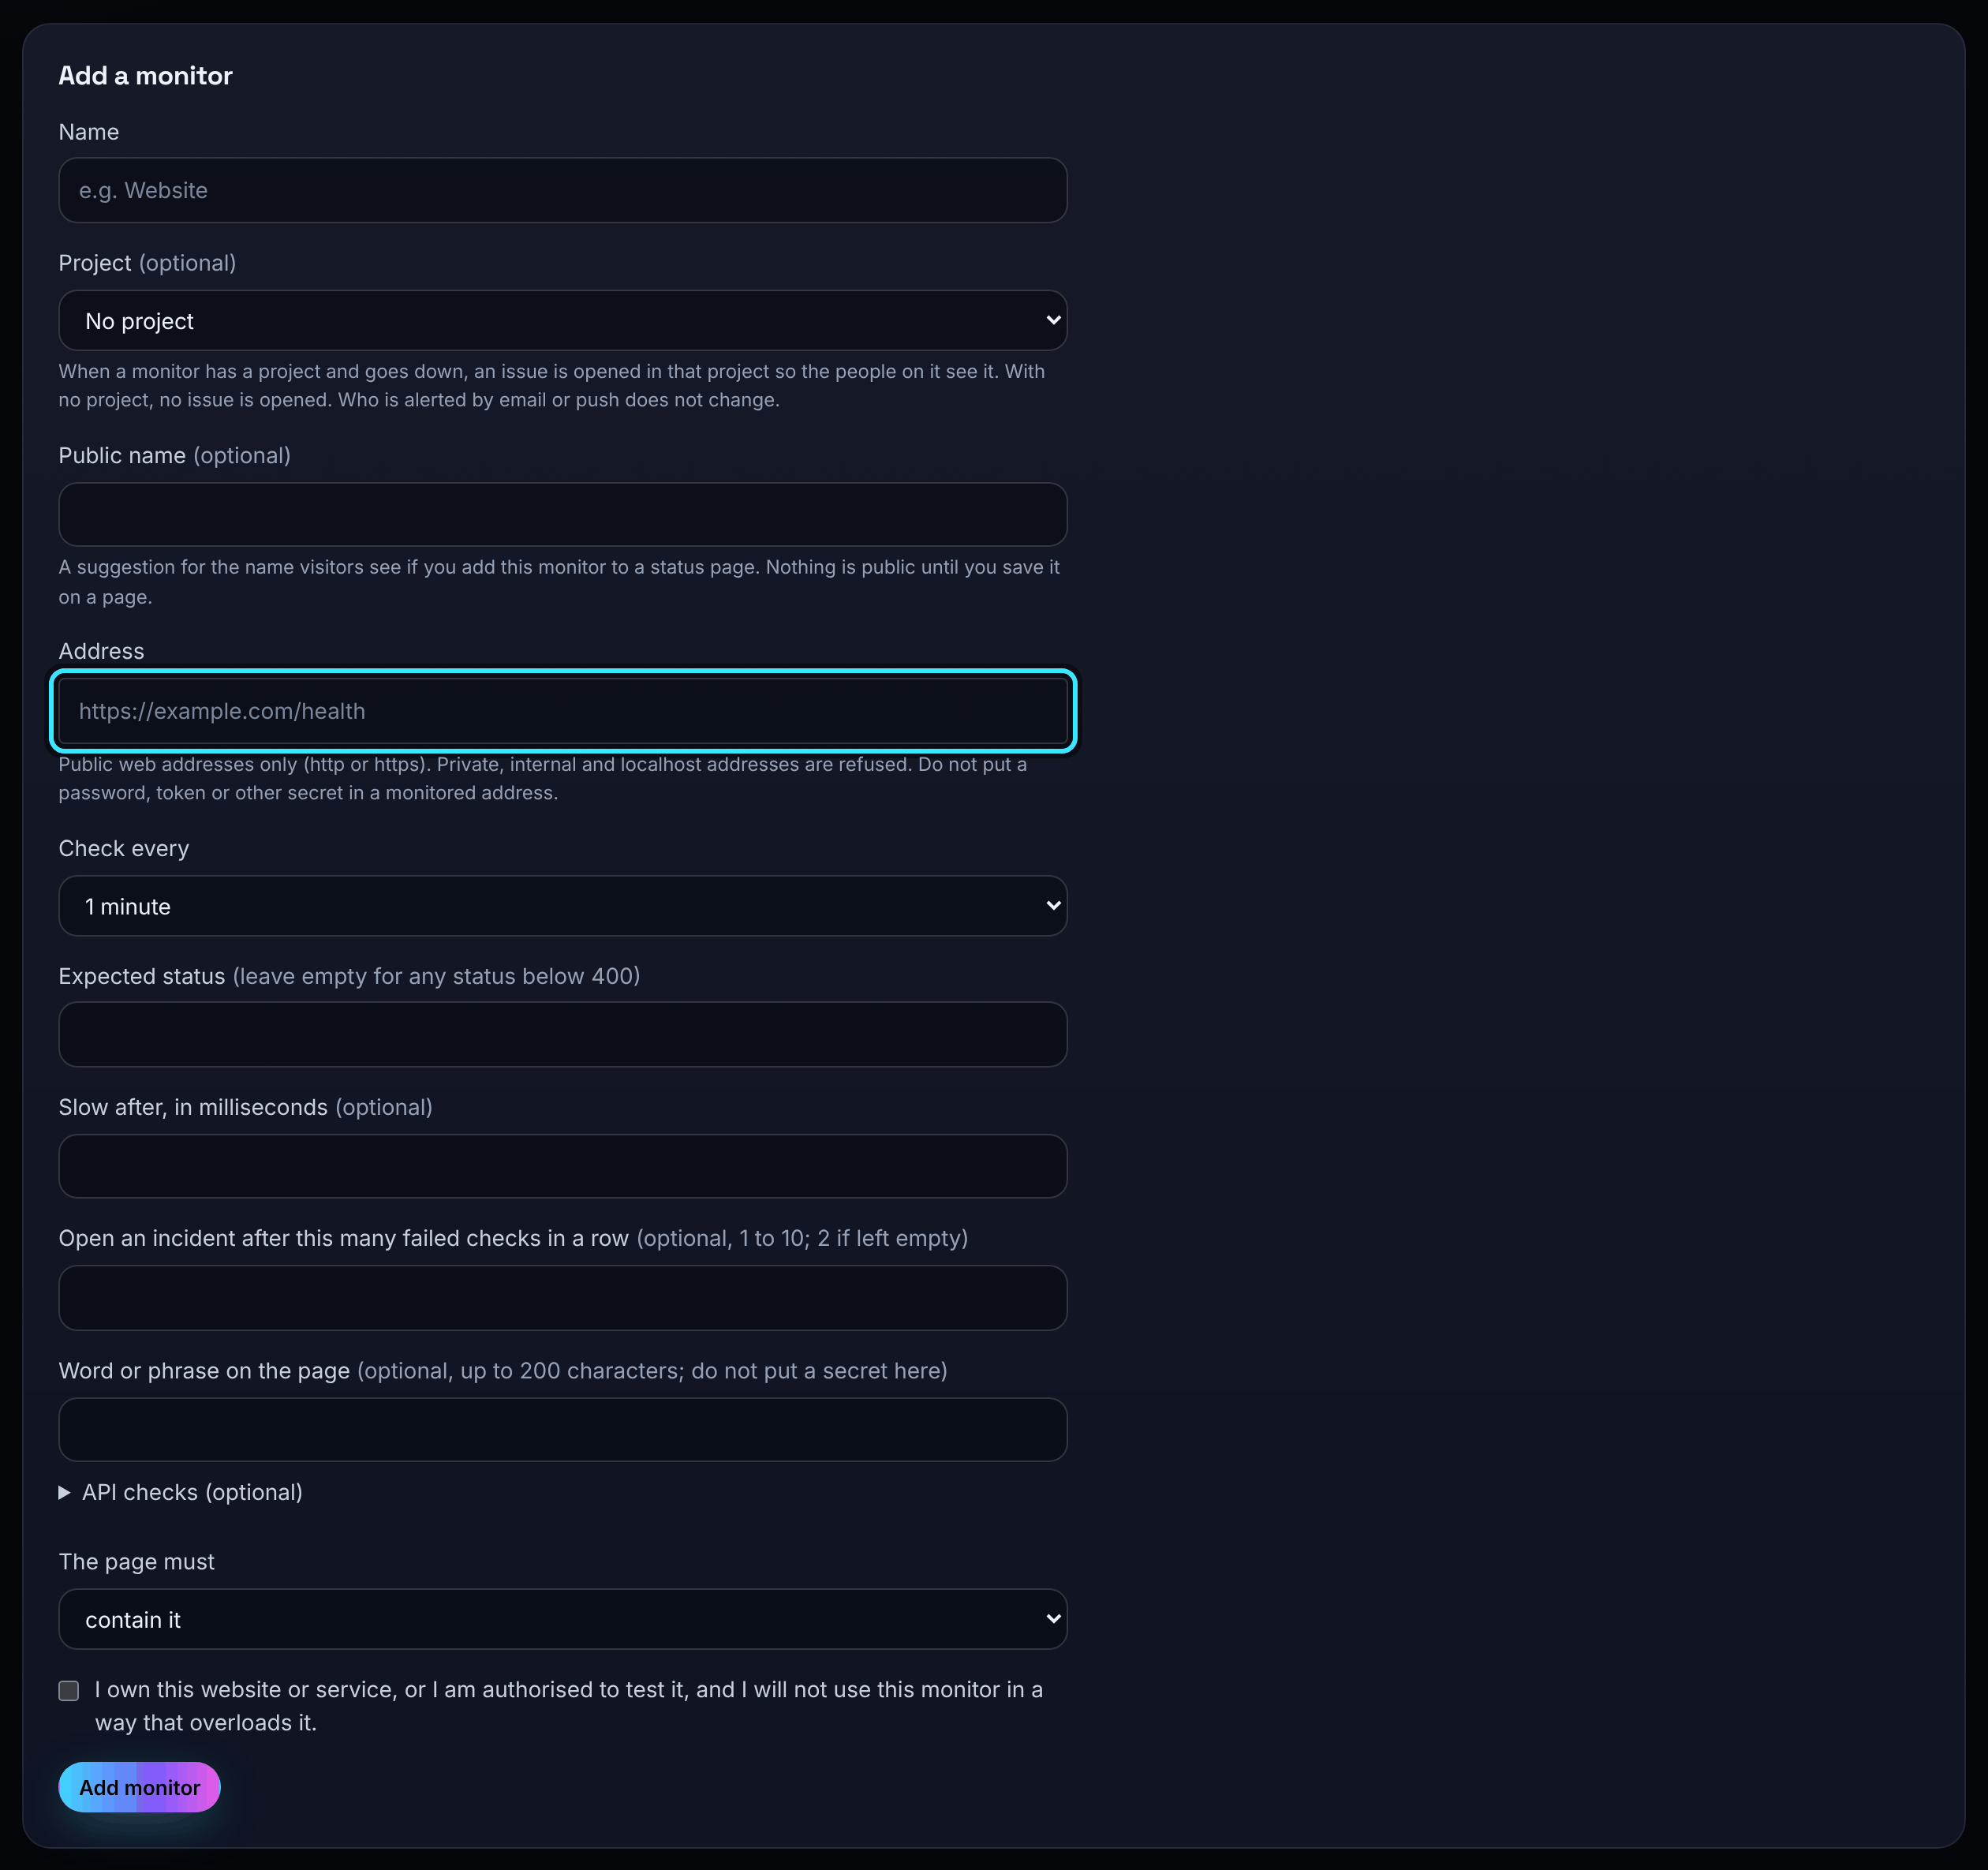
Monitor settings
| Setting | What it does |
|---|---|
| Name | Your private name for it, up to 100 characters |
| Project (optional) | When the monitor goes down, an issue is opened in this project so the people on it see it |
| Public name (optional) | A suggestion for the name visitors see if you add it to a status page. Nothing is public until you do |
| Address | A public http or https address. Private, internal and localhost addresses are refused. Do not put a password, token or other secret in it |
| Check every | 1, 5, 10, 15 or 30 minutes, or 1 hour, no faster than your plan allows |
| Expected status | A status code from 100 to 599. Left empty, any status below 400 passes |
| Slow after, in milliseconds | Above this the monitor shows as Slow (50 to 60,000) |
| Open an incident after this many failed checks in a row | 1 to 10; 2 when left empty |
| Warn this many days before the certificate runs out | 1 to 365; 30 when left empty. To change it later, open Certificate warning on the monitor's row |
| Word or phrase on the page | Up to 200 characters, with The page must contain it or not contain it |
| API checks | A response header that must be present (and optionally its value), and a JSON path (such as data.items.0.name) with the value it must equal |
Checks use GET, follow up to five redirects and wait up to 10 seconds for an answer. The page and API checks are judged from the first 256 KiB of the reply, and only pass or fail is kept. Do not put a secret in any of these settings.
The monitors you can have depend on your plan: 10 on Free, 30 on Solo and 100 on Team. Heartbeats and Coolify monitors count towards the same number.
What is checked, and what is kept
Checks run from more than one place (see the Terms of Service, G8, and the Privacy Policy). A failure is confirmed from a second place before it opens an incident, and a recovery is confirmed the same way. Checks cannot reach private or internal addresses.
For each check AperioFlow keeps the time, whether it passed, how long it took, the status code and a short fixed reason. It does not keep the page or API response.
How long things are kept: individual check results 30 days (14 on Free); hourly totals, resolved incidents and alert records for the plan history period (14 days Free, 90 Solo, 12 months Team); alert webhook delivery records 30 days.
Monitor states
| State | Meaning |
|---|---|
| Up | The last check passed |
| Slow | The last check passed but was slower than the limit you set |
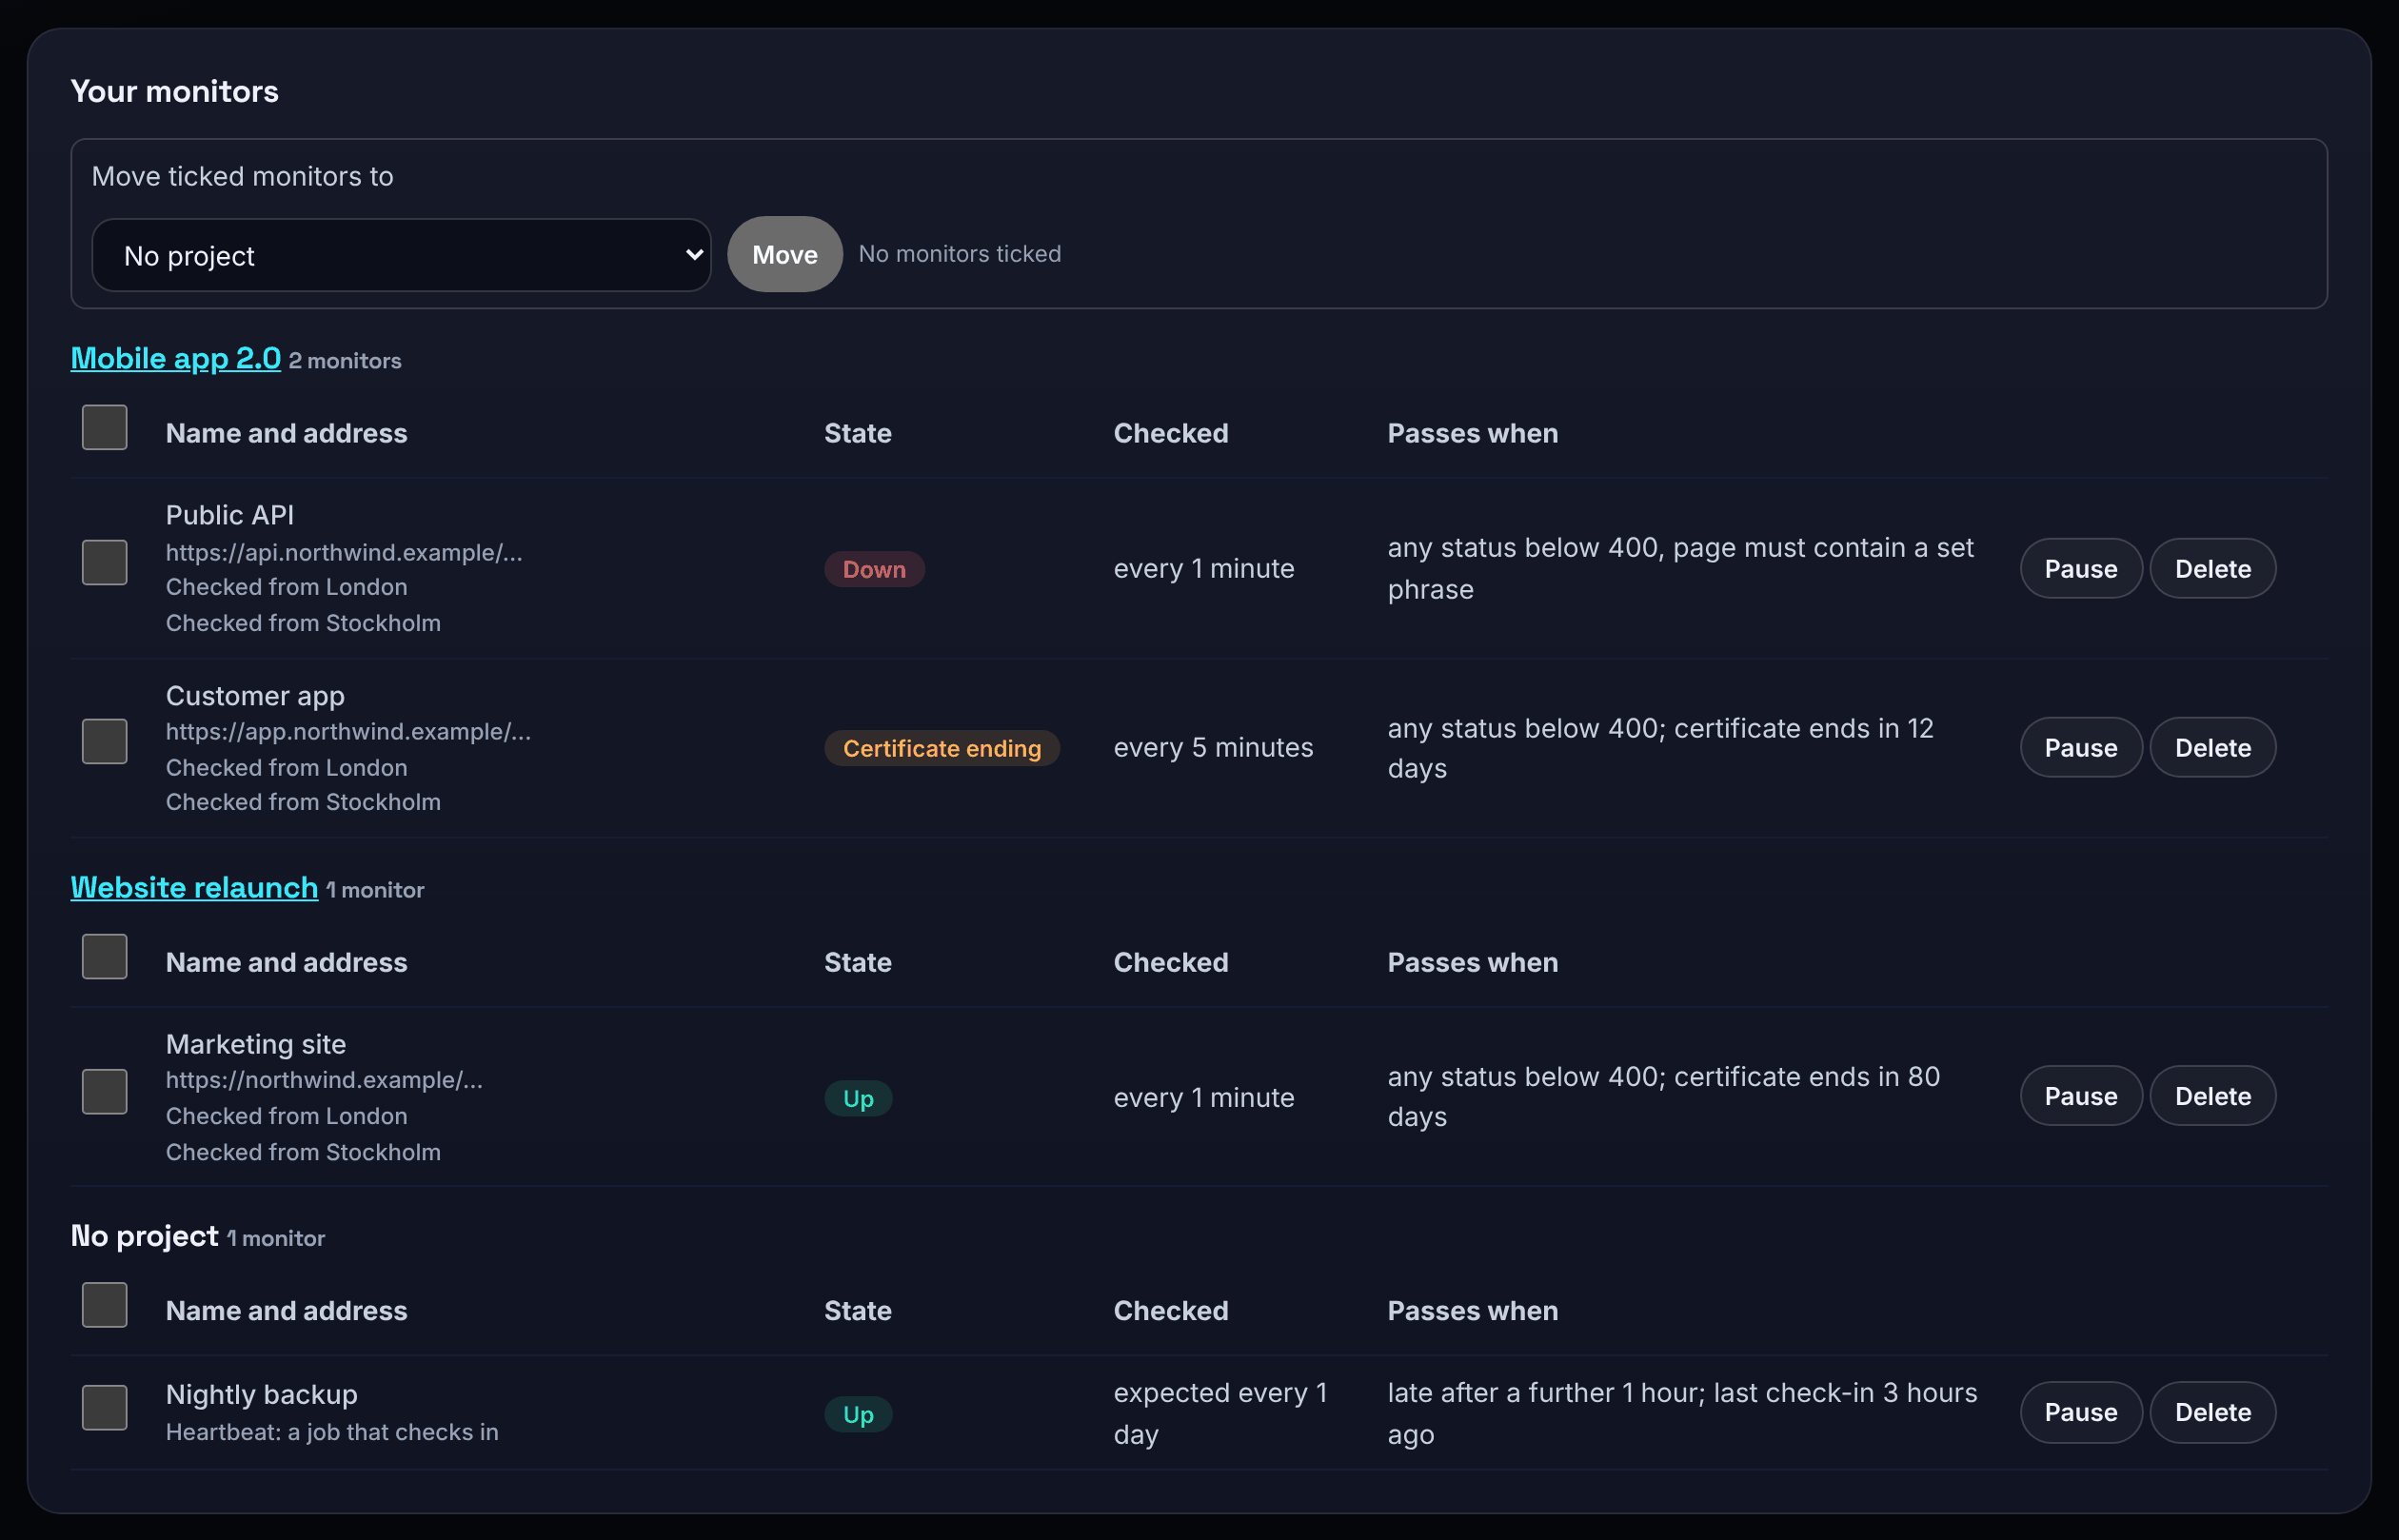
| Certificate ending | The site works, but its certificate runs out within the monitor's warning days (30 unless you changed it). Renew it before then |
| Checking | The last check failed. It is being checked again before anyone is told |
| Down | Confirmed down: the checks failed more than once |
| Maintenance | A maintenance window is running: checks carry on, but nobody is alerted |
| Paused | Paused by you. It is not checked |
| Waiting | Saved, and waiting for its first check (or a heartbeat's first check-in) |
| No recent check | No location has checked it recently, so the result shown is old. Do not rely on it |
| Off for your plan | Switched off to fit your plan. Nothing was deleted; it comes back if the plan allows |
Hover over a state to read its explanation. The Checked column says how often it is checked, and Passes when sums up its rules.
Incidents and alerts
When a check fails and the failure is confirmed, AperioFlow opens an incident and an issue on the monitor's project. A failure is confirmed by a second look about a minute later; you can ask for more failed checks in a row (up to 10) on a monitor, to avoid being told about a brief blip. When it recovers, both close. You can be told by email, by web push and by a signed webhook: once when it goes down and once when it recovers. Alert emails are service messages to members of your organisation and carry no marketing.
An alert webhook address is outside AperioFlow, so add only one you control or trust (Terms, G8).
Use a maintenance window to silence alerts while you work. Incidents, maintenance and alerts covers all of this in detail.
Heartbeats: cron jobs and backups
Create a monitor of type Heartbeat. It gives you a secret address. Have your job call that address when it finishes, for example by adding curl -fsS <the address from the monitor> > /dev/null as the last line of the script.
Set how often it should call and a grace period. If a call does not arrive in time, an incident opens; the next call closes it. Treat the address like a password. Only a hash of it is stored.
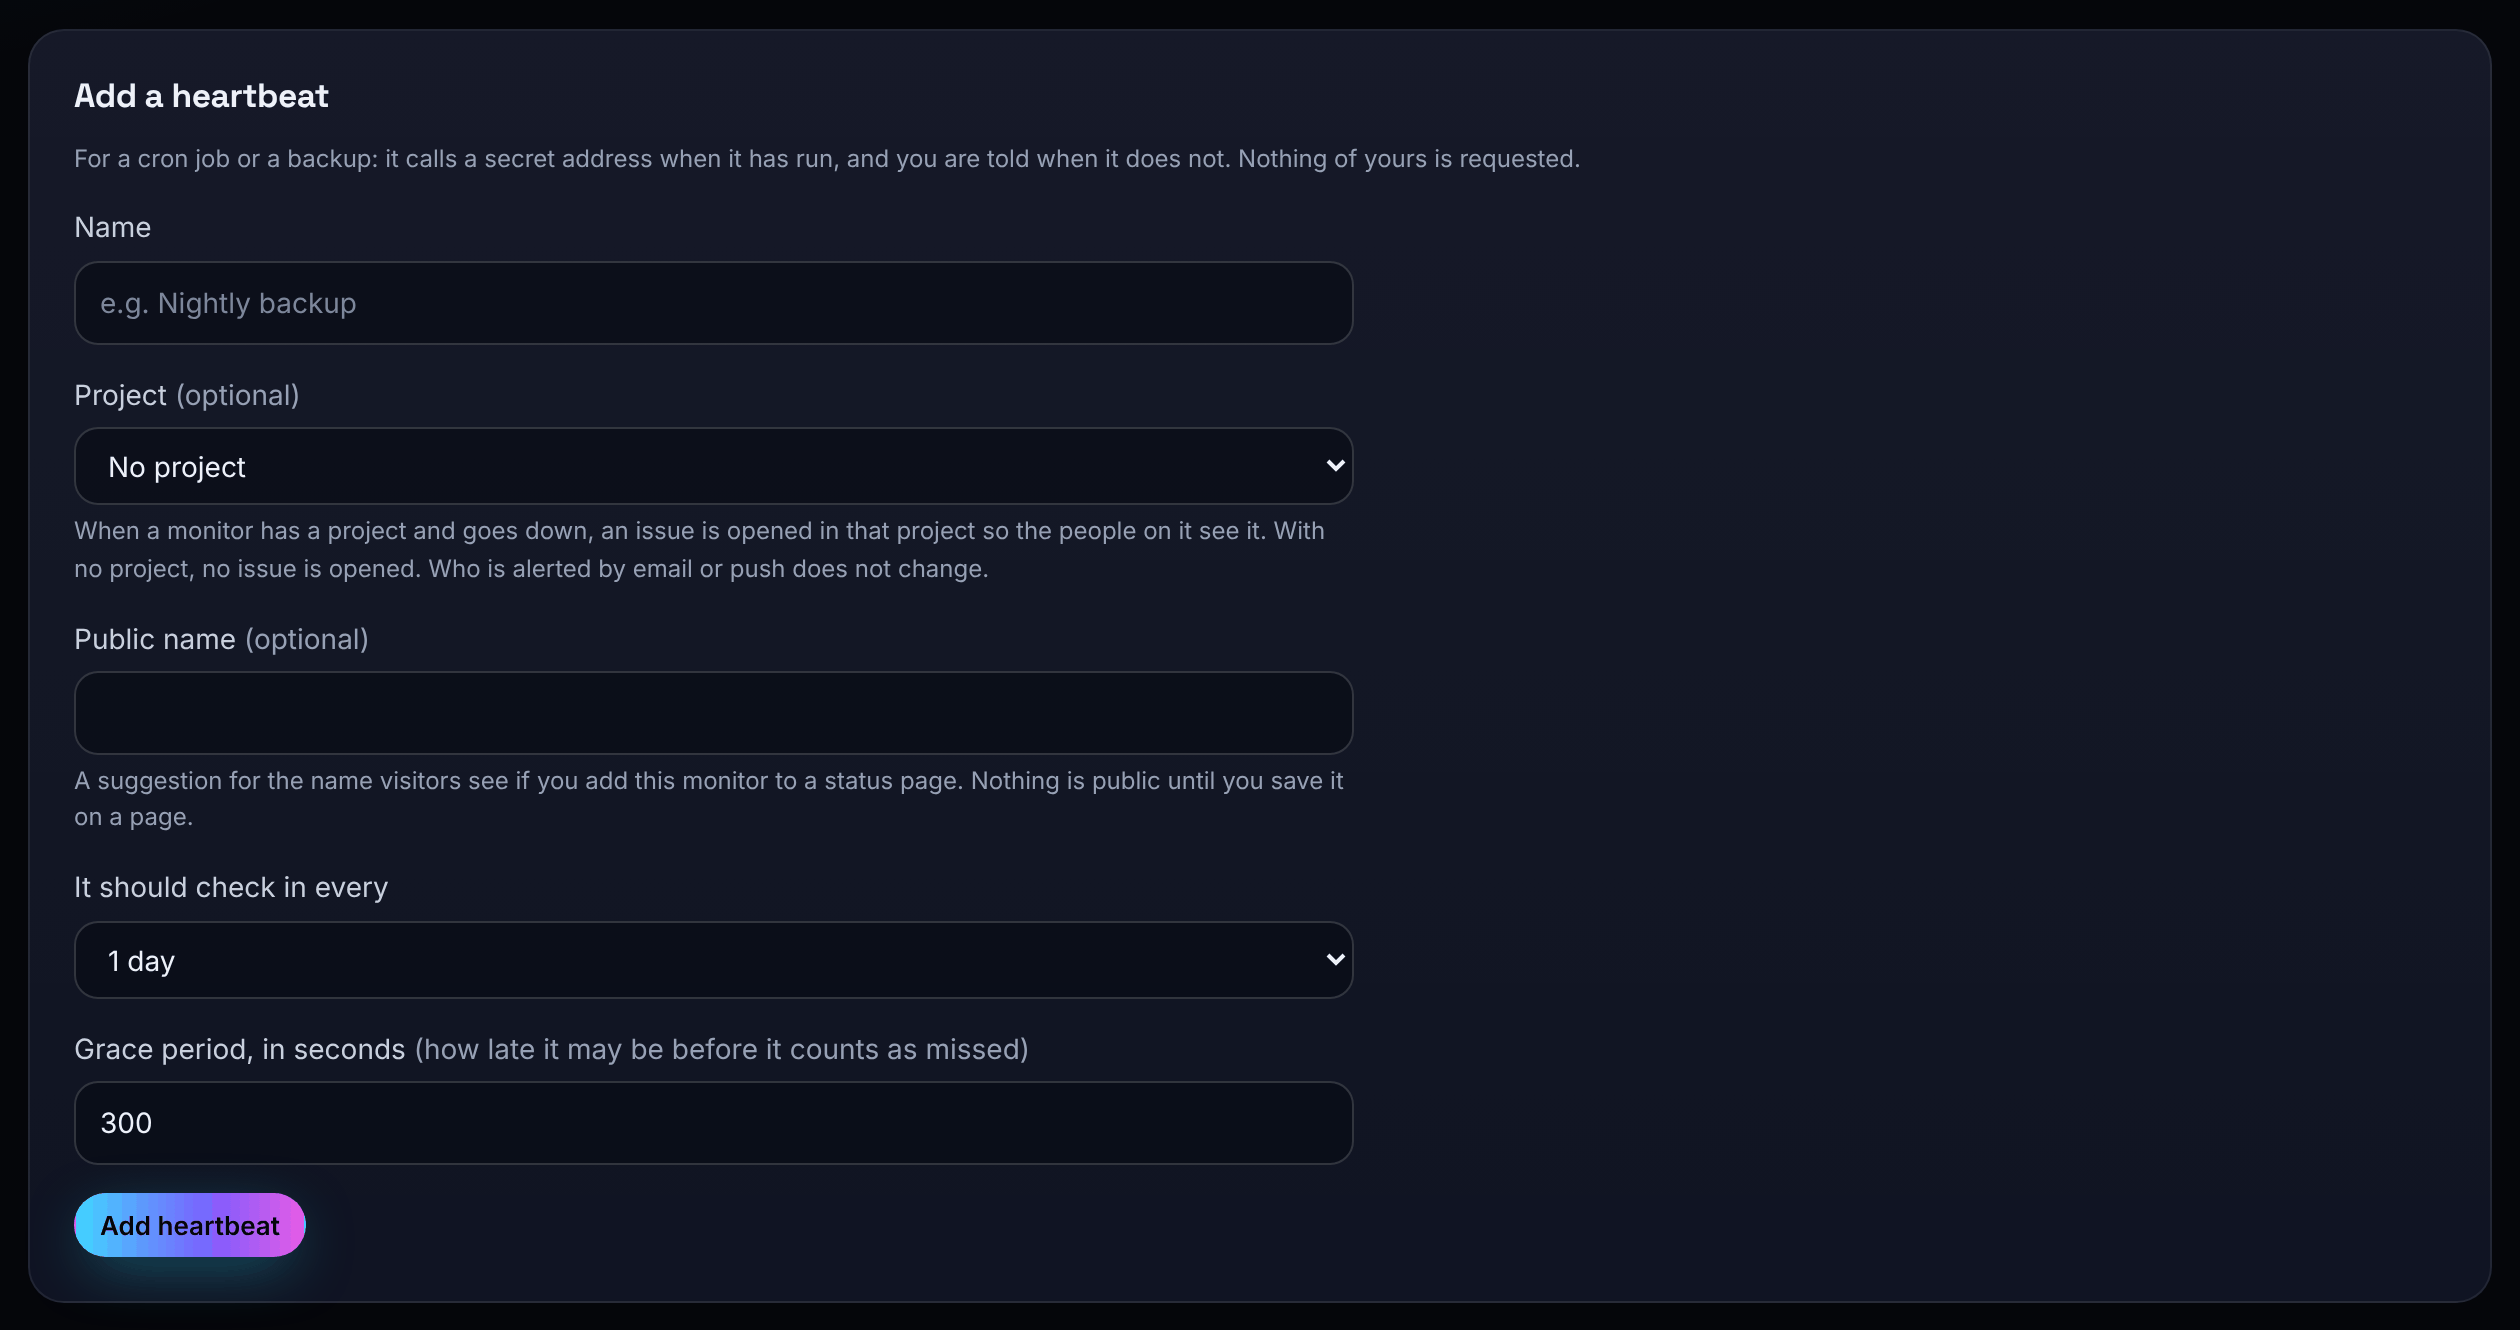
- Choose Add a heartbeat.
- Give it a Name (for example "Nightly backup"), and optionally a project and a public name.
- Choose It should check in every: 1 minute, 5 minutes, 15 minutes, 1 hour, 6 hours, 1 day or 7 days.
- Set the Grace period in seconds: how late it may be before it counts as missed (300 when left as it is).
- Choose Add heartbeat, then Copy address. The address is shown once only.
The job can call the address with GET or POST; nothing is sent back to your server.
Pause, delete and organise monitors
- Pause stops checking a monitor (and closes an open incident); Resume starts again.
- Delete removes a monitor after you confirm. Its address stops being watched.
- To put monitors in a project, tick them, choose the project under Move ticked monitors to a project and choose Move (up to 100 at once). Monitors with a project are grouped under it.
Monitor settings cannot be changed on the page. To change one, add a new monitor and delete the old one, or change it through the API with PATCH /api/monitors/{id} (see API: monitors, alerts and Coolify).
Members, admins and owners can add, pause, move and delete monitors. Viewers can see them.
Coolify
Give AperioFlow a read-only Coolify API token and it can find your applications and databases, watch their state, and spot a container that keeps restarting. The token is stored encrypted, is not shown again, and is used only to read state. Create it with read-only permission. Coolify checks are included on Solo and Team.
Coolify only tells AperioFlow what Coolify itself reports about a container, so a container that is running can still be serving errors. Add a web monitor for the same service as well: it checks the address your visitors use. If AperioFlow cannot reach Coolify for a while, that is shown as a single incident about the connection, not as every one of your applications being down. See Coolify for the steps.